Instruction
for CADLIVE Simulator
Example:
TCA cycle
S-System Analysis
NOTICE
If there is anything wrong with calculation and you want to kill your job, access the site of http://kurata01.bse.kyutech.ac.jp/TEST/Life/kill, and push the kill simulator button.
Instruction
This demonstrates how to convert GMA into S-system, and how to analyze the sensitivities and stabilities of S-system at the steady state.
1. Input GMA
2. Solve the GMA at the steady state. GMA is solved by algebraic equations.
3. Based on the steady state value, GAM is converted into S-system.
4. Solve the sensitivities and stability of the S-system.
Open http://kurata01.bse.kyutech.ac.jp/TEST/Life/index.html
on a PC browser to display the screen (Fig. 1). Input the user name,
subsequently his/her password to start up simulation.
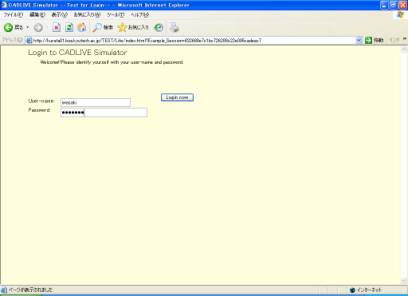
Fig. 1
Login screen
To input the TCA cycle mathematical model from the database, click the Math model data button. When Fig 2 appears, select "Demo: TCA cycle S-system".
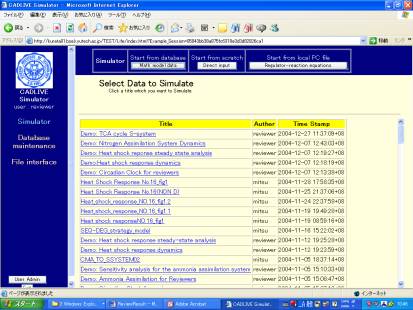
Fig. 2 Selecting the TCA cycle model.
In the following screen (Fig. 3), click "Go to Select Analysis Type".
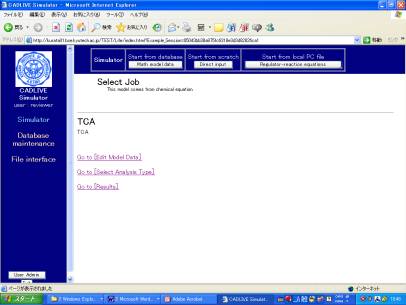
Fig. 3 Screen for selecting a job
Next, select "Steady-state" as analysis type in Fig. 4, and click the submit button.

Fig. 4 Screen for selecting an analysis type
Set the control data for solving the algebraic equation of GMA in Fig. 5. G-value must be set as 1. The ratio of perturbation that is given to parameters is set as change width calc. sensitivity (STD). After setting the control parameters, click the confirm button.
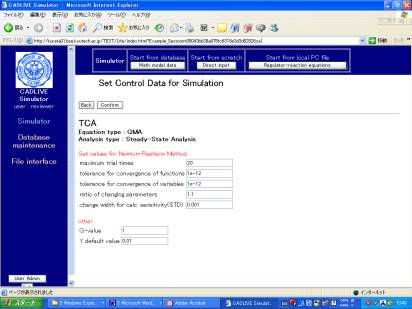
Fig. 5 Screen for setting control data for steady-state analysis
The screen for setting parameters and initial values appears as shown in Fig. 6. In this instruction, since these values have bee already provided, click the confirm button. To calculate the steady state concentrations, sensitivities and stability (eigenvalue), click the submit button in the next screen.
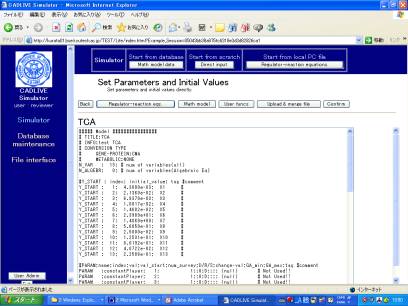
Fig. 6 Screen for setting parameters and initial values
The resultant steady-state concentrations, sensitivities and stability are displayed as shown in Fig. 7.
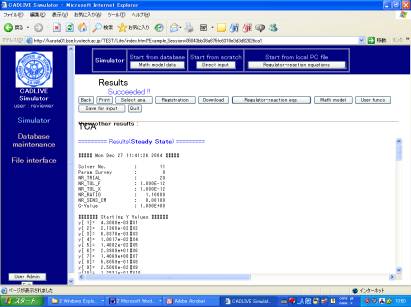
Fig. 7 Results of steady-state concentrations, sensitivities, and stability
To perform S-system analysis, click the "Select ana button" in the screen (Fig. 7). Check the box of "Use S-system" in the following screen (Fig. 8), and click the submit button. After confirming the analysis type, submit the job in the next screen.
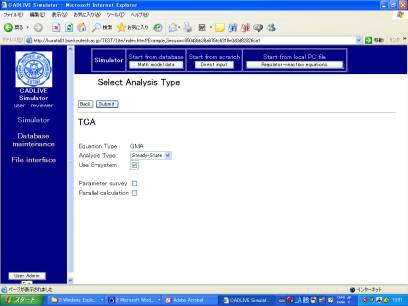
Fig. 8 Screen for selecting the analysis type.
The screen for setting the parameter values and initial values (Fig. 9) appears, which have been already calculated based on the GMA result. Thus, just click the confirm button, subsequently push the submit button.
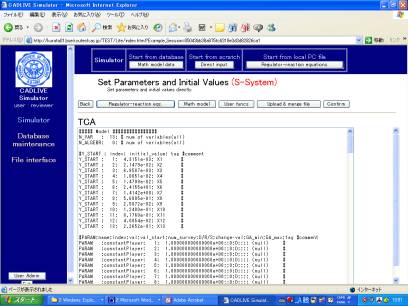
Fig. 9 Screen setting the parameter values and initial values
The resultant sensitivities and stability (eigenvalue) are shown in Fig. 10.
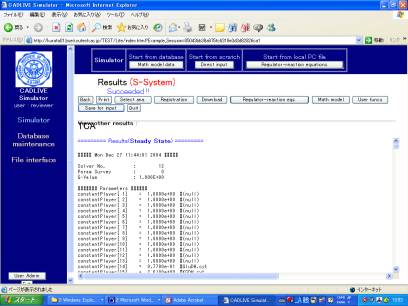
Fig. 10 Results of sensitivity and stability (eigenvalue): Steady-state values (STD), fluxes, logarithmic gains of metabolites, sensitivities of metabolites with respect to rate constants, sensitivities of metabolites with respect to kinetic orders, logarithmic gains of fluxes, sensitivities of fluxes with respect to rate constants, sensitivities of fluxes with respect to kinetic orders, and stability.