Maximum entropy decomposition of flux distribution at steady state to elementary modes
Download
The Matlab file with the input file and manuals
Supplementary Data for the JBB paper.
What is Elementary Mode Coefficient (EMC)?
With the developments of 'omics' technologies, it is possible to reconstruct genome-scale networks for microorganisms, plants, animals and human. Metabolic pathways analysis based on Elementary Mode (EM) or Extreme Pathway (EP) is helpful for the analysis of metabolic networks. EM is provided as follows:
![]() ,
(1)
,
(1)
where P is the elementary mode matrix in which the rows represent the reactions and the columns correspond to the elementary modes; λ is the EMC vector and v is the flux vector.
A flux distribution is decomposed onto
If the external fluxes are provided, the
intracellular fluxes could be estimated by them. In general, the optimization
of EMCs is an underdetermined problem because the number of
What is Maximum Entropy Principle (MEP)?
In the information technology, the Shannon
entropy or information entropy is a measure of the uncertainty associated with
a random variable proposed in 1948 by
 ,
(2)
,
(2)
where ρi is the probability and
 .
.
Edwin Thompson Jaynes proposed the maximum entropy principle in his famous papers in 1957. If we want to characterize some unknown events with a statistical model, we should always choose the one that has Maximum Entropy. Another similar description is that out of all probability distributions consistent with a given set of constraints, we choose the one that has maximum uncertainty. Entropy is regarded as a measure of information. Use of Maximum Entropy avoids presenting any subjective hypothesis for the optimization. It is widely applied in the field of informatics technology, including bioinformatics such as gene expression analysis or sequence analysis, while it isn't used for the optimization of EMCs. The most possible probabilities for a metabolic flux distribution should be obtained by MEP.
How to use this program?
Application program:
The file 'mep1.m' is a Matlab program for the optimization of elementary mode coefficients (EMCs) by the maximum entropy principle (MEP).
Structure of the input file:
Before the running of this program, some information is necessary for optimization, including the metabolic network model and the experimental flux data. The metabolic network models could be reconstructed by CADLIVE (www.cadlive.jp) or other softwares. The elementary modes of the networks could be calculated by FluxAnalyzer or CellNetAnalyzer (www.mpi-magdeburg.mpg.de/projects/fluxanalyzer).
An input file must be organized in the particular data structure shown below to present the suitable information for the metabolic system (Figure 1).
The input file is edited in text notepad or Matlab, and saved as a text file (filename.txt). The input file is freely named by users.
The first part indicates the number of reactions in the system (NR), the number of the determined fluxes from the external metabolites (ND), and the flux of the uptake reactions which are the basic parameters for the metabolic network.
The second part indicates the part in the elementary mode matrix that provides the constraint of EMCs. It is an NDxNEM (Number of Elementary Modes) matrix. Since the data is read line by line, NEM is counted.
The third part indicates the determined or measured external fluxes. It is a 1xND row vector.
The fourth part indicates the 1xNEM row vector for calculating the uptake flux by using EMCs. It provides the constraint of the probabilities that the sum of them is equal to 1 (Eq. (2)).
The last part indicates the elementary mode matrix (NRxNEM). It is utilized to calculate the flux distribution for all of the reactions in the metabolic models.
Figure 1. A content of the input file
![]() is the uptake flux from an external
metabolite. Note that this file does not need to bind the external fluxes as
shown in the figure. The program automatically detects the external fluxes,
because they are given in the second and third parts.
is the uptake flux from an external
metabolite. Note that this file does not need to bind the external fluxes as
shown in the figure. The program automatically detects the external fluxes,
because they are given in the second and third parts.
Running this program
The original program, mep1.m, is written in Matlab (The MathWorks, Inc; version 7.0.1.24704, R14).
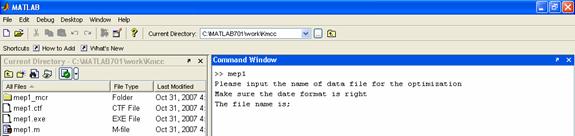
Just write mep1 in the command line in Matlab and then push the Enter key.
>> mep1
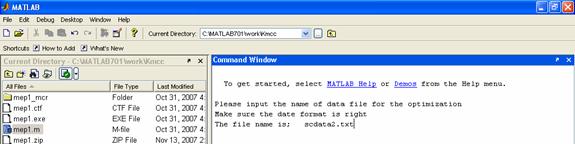
If you are asked the input file name, enter 'scdata2.txt'.
The results are automatically saved in two text files. The optimal EMC is saved in outputEMC.dat and the flux distribution for all of the reactions is saved in outputflux.dat.
An example for Saccharomyces cerevisiae:
The experimental flux distribution is cited from the papers of Frick et al (2005). The input file is scdate2.txt as shown in Figure 2.
There are 40 reactions in this model. The external fluxes of glucose, acetate, ethanol and glycerol are set to be the experimental data. In them, the uptake flux of glucose is 100. All the input data in scdata2.txt was organized in the formation mentioned above.
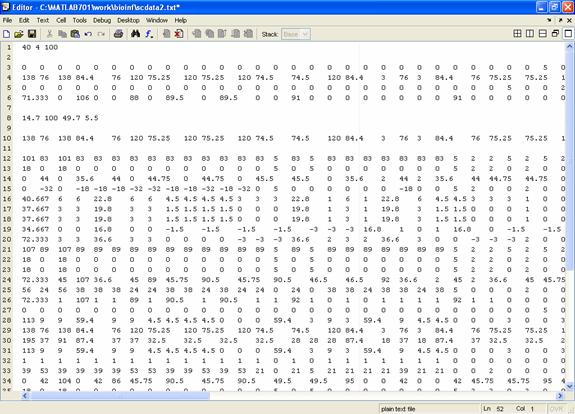
Figure 2. The input file for S. cerevisiae in Matlab.
Run mep1.m in the command line, and then input 'scdata2.txt' as shown in Figure 3. The optimization result will be made automatically. The output files are shown in Figure 4.
(A)
(B)
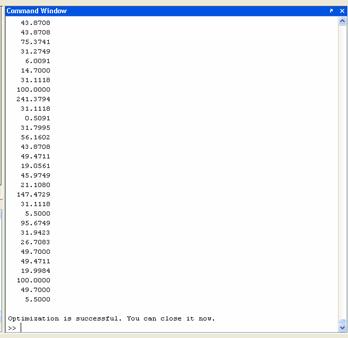
(C)
Figure 3. (A)The first window after running of mep1.m in Matlab; (B) The second window to input the text file (scdata2.txt); (C) The window after the optimization.
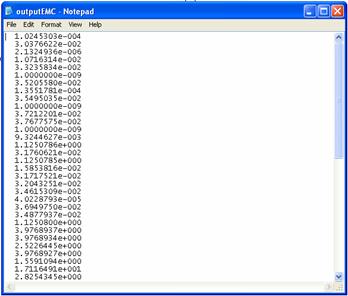
(A)
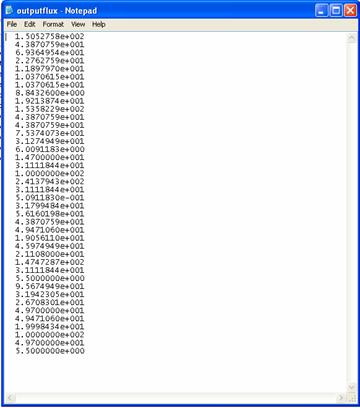
(B)
Figure 4. The saved results. (A) Elementary mode coefficients in outputEMC.dat; (B) Flux distribution in outputflux.dat;
The EMCs calculated by MEP, QP and LP are shown in Figure 5. The flux distributions are predicted in Figure 6.
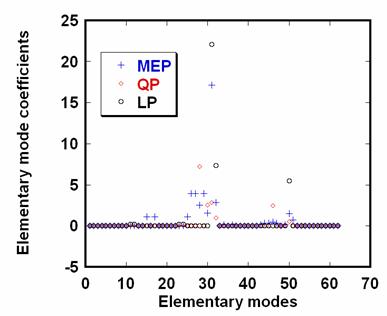
Figure 5. The Elementary Mode Coefficients (EMCs) for S. cerevisiae (μ=0.30 h-1) optimized by Maximum Entropy Principle (MEP), Quadratic Programming (QP) and Linear Programming (LP, the objective function is the maximum biomass formation here)
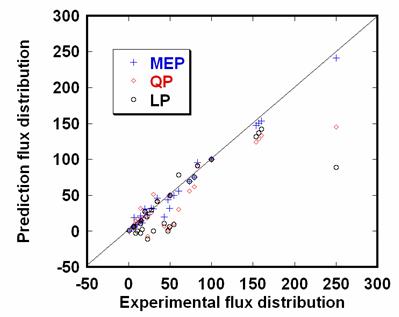
Figure 6. The flux distribution for S. cerevisiae (μ=0.30 h-1) calculated by Maximum Entropy Principle (MEP), Quadratic Programming (QP) and Linear Programming (LP, the objective function is the maximum biomass formation here).
References
Frick O, Wittmann C. (2005) Characterization of the metabolic shift between oxidative and fermentative growth in Saccharomyces cerevisiae by comparative 13C flux analysis, Microb Cell Fact, 4, 30.
Gayen K, Venkatesh KV. (2006) Analysis of optimal phenotypic space using elementary modes as applied to Corynebacterium glutamicum, BMC Bioinformatics, 7, 445
Jaynes ET. (1957) Information Theory and Statistical Mechanics,Phys Rev, 106, 620-630.
Jaynes ET. (1957) Information Theory and Statistical Mechanics II, Phys Rev, 108, 171-190.
Schwartz JM, Kanehisa M. (2005) A quadratic programming approach for decomposing steady-state metabolic flux distributions onto elementary modes, Bioinformatics, 21 Suppl 2, ii204-205.
Shannon CE. (1948) A mathematical theory of communication, Bell Syst Tech J, 27, 379-423 and 623-656.