Summary of CADLIVE (Computer-Aided Design of LIVing systEms)
Pathway search for virtual
knockout mutants
JUMP TO URL SITE
CADLIVE GUI Network Constructor with a Pathway Search Module for Knockout Mutants
CADLIVE Automatic Layout
CADLIVE
Dynamic Simulator
CADLIVE Converter
References
Kentaro
Inoue, Sayaka Tomeda, Shinpei Tonami, Yuki Shimokawa, Masayo Ono, Hiroyuki
Kurata, CADLIVE Converter for constructing a biochemical network map. Biochem Eng J 54:200–206, 2011.
Introduction
CADLIVE is a comprehensive computational tool that analyzes and rationally designs large-scale biochemical networks at the molecular interaction level. It consists of a GUI network constructor, database, a pathway search module for knockout mutants, a network layout module, and the dynamic simulator that automatically converts biochemical network maps into mathematical models.
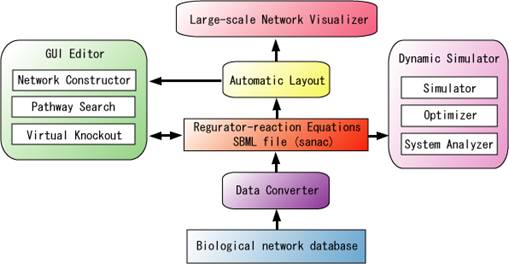
Figure The whole image of CADLIVE
CADLIVE GUI network constructor
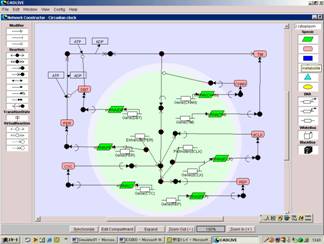
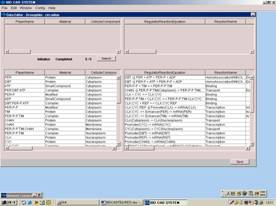
Figure GUI network constructor and SBML based database
Place species symbols by dragging and binds them by reaction arrows in the panel.
Drawing a biochemical network (left) by the GUI constructor automatically generates SBML-based regulator reaction equations (right).
Table Fundamental graphical notation based on the regulator-reaction model
Details are described elsewhere.
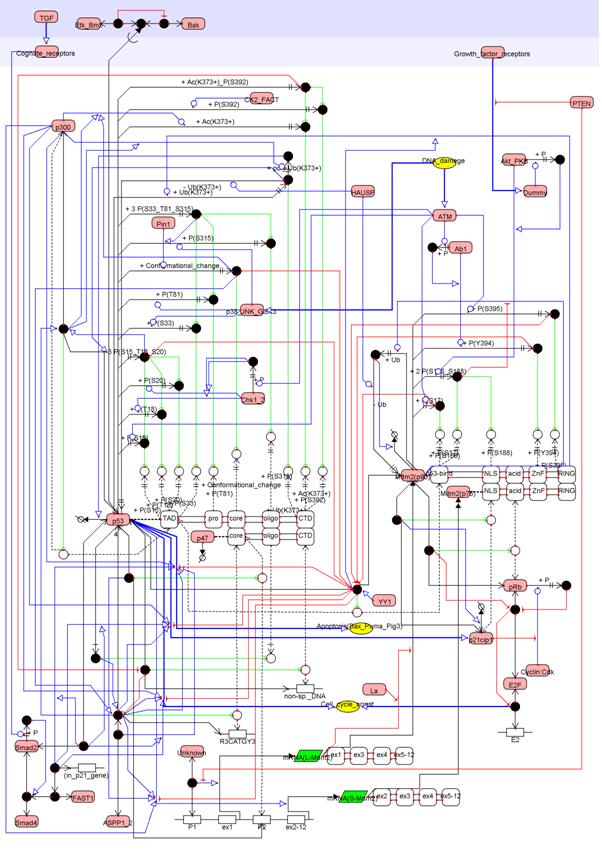
Figure A biochemical map of p53 drawn by CADLIVE
Pathway
search for virtual knockout mutants
We developed a pathway search module for virtual knockout mutants as a built-in application of CADLIVE. This module analyzes gene function in the same way as molecular genetics, which simulates a change in mutant phenotypes or confirms the validity of the network map.
(A)
(B)
(C)
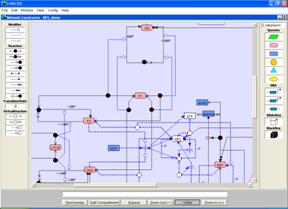
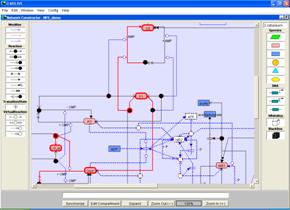
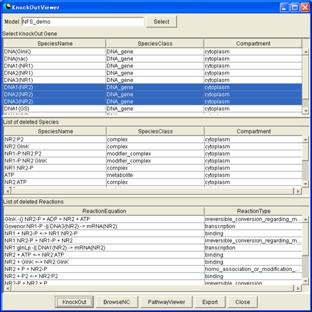
Figure Pathway search for knockout mutants
(A) The window for virtual knockout. The blue-highlighted species are removed by clicking the "KnockOut" button in the bottom part. The deleted species and reactions appear in the middle and bottom tables.
(B) The dotted symbols and lines are the deleted species and reactions on the network constructor.
(C) Pathway viewer for the knockout mutant. When specific pathways are searched in the knockout mutant, the resulting pathways are marked in the red lines on the network constructor.
Automatic layout
system
CADLIVE automatically layouts a biochemical network map by calculating the coordinates of all the molecular species. This facilitates exploring topological structures such as modularity.
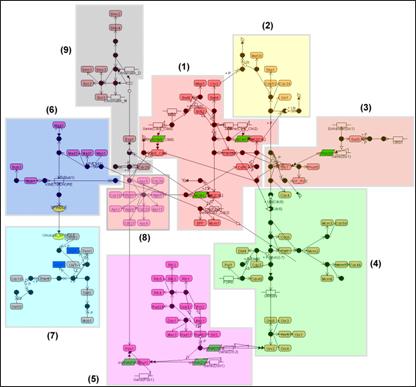
Figure An automatically drawn map of the budding yeast cell cycle network
Dynamic simulator
The dynamic simulator is a client-server model.
It automatically converts a biochemical network map into a dynamic model.
It supports optimization, system analysis,
and Gird computation.
Figure
A process flow of CADLIVE
Figure Two stage and three layer model for converting regulator-reaction equations into a mathematical model.
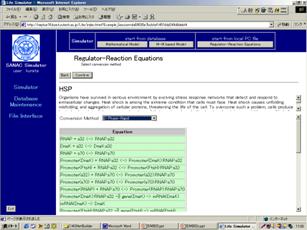
Figure Input of the biochemical network map created by the CADLIVE GUI network constructor
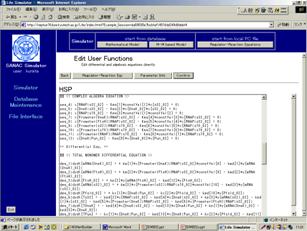
Figure Mathematical equations that CADLIVE automatically converts the input biochemical network file into.
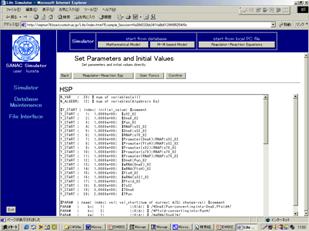
Figure Windows for setting the values of biochemical parameters
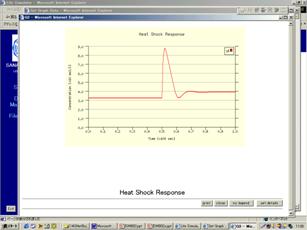
Figure Simulation results calculated by CADLIVE.